
Enhancing Wearable Tech with Advanced Data Management Solutions
In the evolving landscape of wearable technology, data is king. The precision with which we collect, manage, and interpret data from wearable devices determines the effectiveness of health monitoring and the potential of AI-driven healthcare solutions. Our SDK is engineered to provide developers with the tools necessary to harness this data, offering robust support for both processed and pass-through data collection.
Table of Contents
What is Processed Data and How to Obtain it from Our SDK
In the realm of wearable technology, processed data stands in contrast to the raw pass-through data derived from sensors like PPG, ECG, accelerometers, and gyroscopes. This data is the product of complex algorithms embedded in the device’s firmware, transforming raw sensor readings into meaningful health metrics that are immediately actionable.
Vital Sign Data Retrieval
Our SDK utilizes the Self_write() function to enable direct commands to the device for fetching real-time, processed data. This data is already computed and formatted for use, unlike raw data that necessitates additional analysis. The range of vital signs accessible includes:
- Current step count for the day
- Sleep quality data, distinguishing between deep and light sleep phases from the previous night
- Real-time heart rate
- Blood oxygen levels (SpO2)
- Body and skin temperature
- Respiratory rate
- Fatigue and stress levels
- Heart Rate Variability (HRV) and R-R Intervals (RRI)
- Intensity of physical activity
Data Collection Frequency
The collection frequency for these vital signs is predefined and permanently set within the device’s firmware, ensuring data is captured in a consistent and reliable manner. Any adjustments to this frequency require firmware updates directly from us, as these settings are not modifiable in real-time through the app or by the user.
Real-Time Data
These data collection in ‘Real-time’, that means the device is programmed to provide the latest readings almost instantaneously upon request. For instance, when querying the current step count, the device responds with the cumulative steps recorded up to that precise moment. Similarly, for heart rate, the app displays the most recent rate monitored by the device.
Processed vs. Pass-Through Data
While pass-through data is the direct, unfiltered output from the device’s sensors, processed data is refined and presented in a user-friendly format. It encapsulates the device’s ability to interpret raw signals, offering users a clear and immediate understanding of their vital statistics.
In essence, our SDK equips developers with the capability to retrieve vital sign data that is not only current but also prepared for direct application in health monitoring and analysis. This contrasts with the more granular, raw pass-through data that requires further processing but is also available through the same comprehensive toolset.
What is Pass-through Data and How to Obtain it from Our SDK
Pass-through data is the unprocessed, raw information collected directly from sensors such as PPG, ECG, accelerometers, and gyroscopes. It reflects the real-time activity and physiological changes detected by these devices, serving as a foundational element for in-depth analysis and algorithm development.
Continuous Raw Data Collection
Utilizing the public void transparentData(int type) function in our SDK, developers can command the wearable device to capture and transmit this raw data. Here’s how it can be harnessed:
(1) PPG (Photoplethysmography)
- a. Currently, the user needs to send a command actively to get PPG data.
- b. It’s possible to customize the development to automatically collect data at a set time.
- c. Automatic data collection and storage can be customized (for this, a switch to X5 or X6 hardware is needed, and several questions need to be answered: How long is a single sampling period (A), e.g., 60 seconds; What are the possible durations for A, e.g., 10/30/60 seconds; How many sets of A are needed, e.g., up to 100 sets; Is there a maximum time requirement, e.g., storing up to 100 sets for 2 days).
Example for PPG:
Let’s say you want to measure the PPG data for 60 seconds at a time (this is your A), and you want to do it every 10 minutes. If you need up to 100 of these 60-second measurements, and you’re looking for the device to store two days’ worth of this data, you need to ensure the battery and storage can handle 100 sets of 60-second measurements taken every 10 mintues for 48 hours.
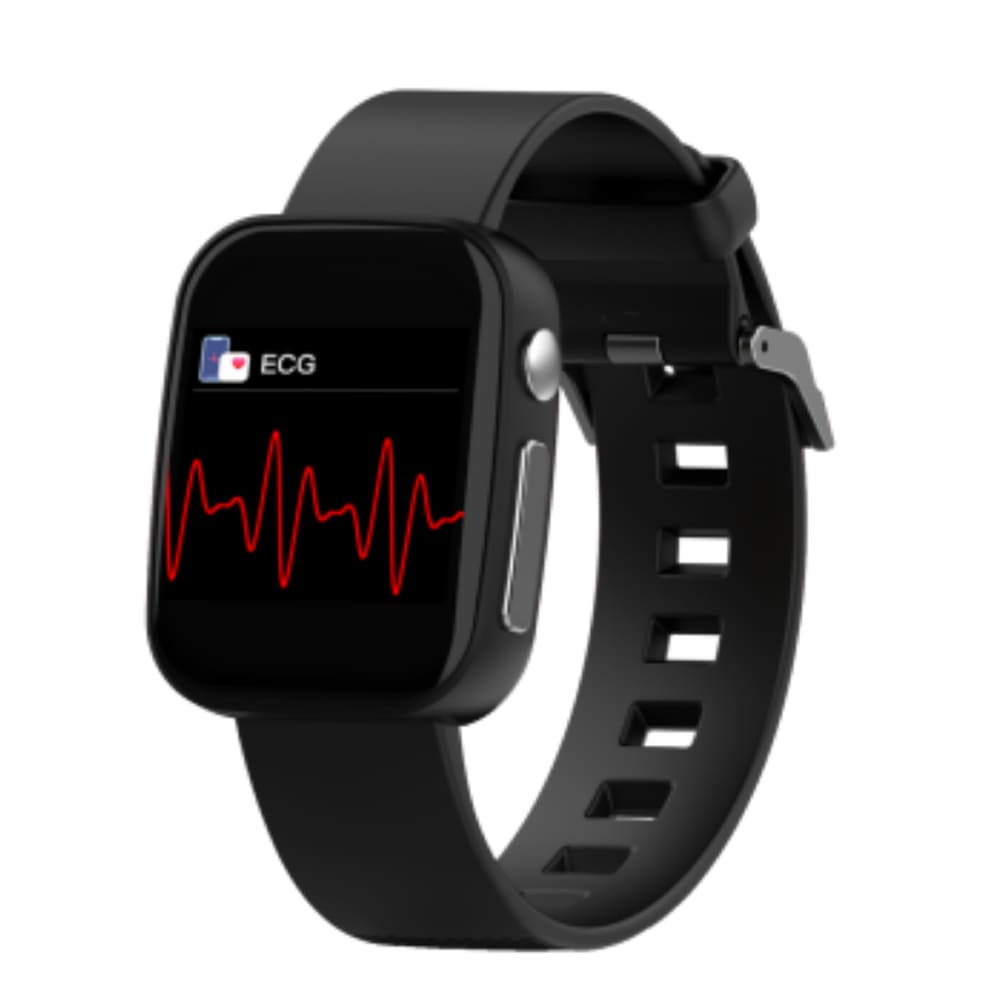
(2) ECG (Electrocardiography)
- a. Currently, ECG data requires user initiation for measurement.
- b. Automatic data collection isn’t possible as ECG requires the user to actively wear and touch the side electrodes.
- c. Other considerations are the same as for PPG.
(3) Accelerometer
- a. The app sends a command to start collecting data.
- b. The default sampling rate is 25Hz.
- c. Customization for 50/100/200Hz sampling rates is possible.
(4) Gyroscope
- a. Data collection is started with an app command.
- b. Sampling rates can be set to 50Hz/100Hz/200Hz (X6 hardware is required for testing these rates).
Example for Accelerometer/Gyroscope:
- If the app needs to collect raw data from the accelerometer at a rate of 100Hz, you would send a command through the app to initiate data collection at this frequency. The device (with X6 hardware) would start sampling the motion data 100 times per second.
The Difference in Data Collection Methods for PPG vs. Accelerometer and Gyroscope:
PPG and ECG often require an active command from the user because these measurements can be sensitive to movement and positioning. For accurate readings, the user may need to be still or touch certain parts of the device (like the electrodes for ECG). The “active command” typically means the user initiates the measurement process, often by pressing a button on the device or in the app to start the measurement.
Accelerometer and Gyroscope data collection can be initiated via the app because these sensors are designed to measure movement continuously and do not require the user to be in a specific state or position. The app can send a command to the device to begin collecting this data at any time, without the user needing to interact with the device.
Storing Data with Precision
Our approach to data storage balances the need for both high-frequency raw data and lower-frequency processed data:
Processed Data
Stored at larger intervals to reflect health trends, such as heart rate recorded every few minutes.
Raw Data
Captured continuously, especially during activities like workouts for granular analysis, and stored at the same high frequency at which it’s collected.
Here to take PPG data as an example to show the strategy for storing two different kinds of data
Efficient Data Storage Strategies for PPG Monitoring in Wearable Devices
Storing Processed PPG Data
When we talk about storing processed data derived from the PPG signal, such as heart rate or Heart Rate Variability (HRV), we usually store this data at set intervals. These intervals are typically longer because we're interested in capturing trends over time, not instantaneous changes. For example, you might store heart rate data every minute, every 5 minutes, or even less frequently, depending on the needs of the application.
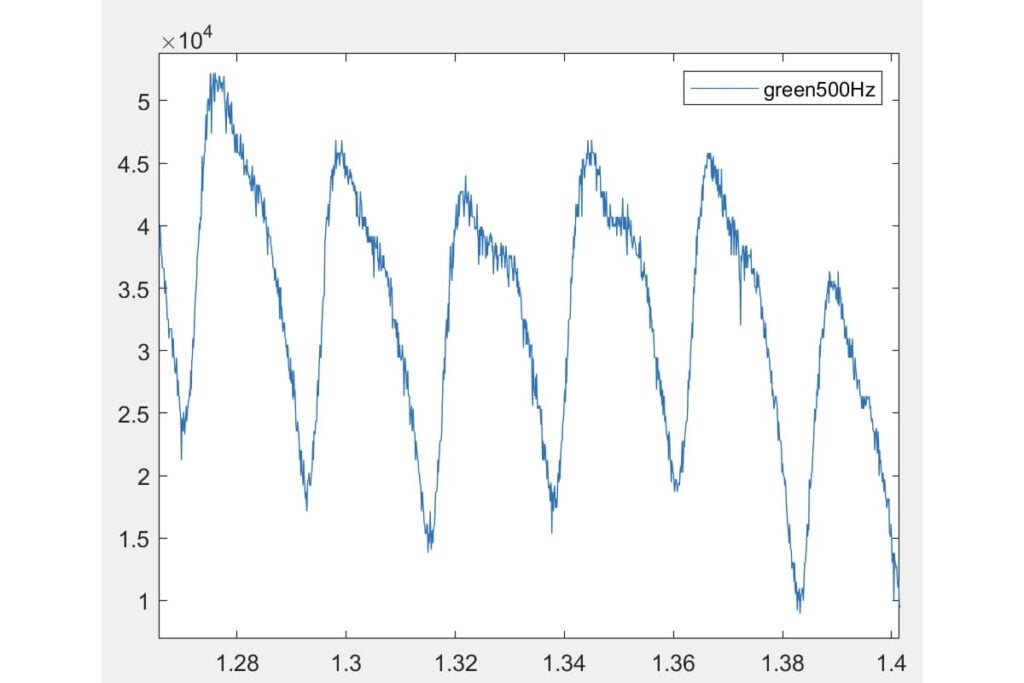
Storing PPG Raw Data
Storing PPG raw data, on the other hand, usually happens at a much higher frequency because the raw signal captures the detailed fluctuations of blood volume with each heartbeat. If you want to store this raw data for later analysis, you would do so at the same high frequency that the data is collected, which could be hundreds of times per second.
Application and Frequency Considerations
The decision to store raw versus processed data hinges on the application's purpose. High-frequency storage is essential for detailed analytical tasks, while lower-frequency storage suffices for routine health monitoring. Our SDK empowers developers to adjust these settings, ensuring the wearable device meets the precise demands of their application, whether it requires continuous high-resolution monitoring or periodic health checks. In essence, our SDK offers a versatile toolkit for managing pass-through data, providing the groundwork for both immediate application and future innovation within AI-driven healthcare solutions.
Historical Data and Custom Storage Solutions
The SDK also facilitates access to a week’s worth of historical data, with storage configurations like four readings per hour for heart rate or one reading per hour for step counts. Customization options enable clients to define their storage methods, specifying the data types, combination, intervals, and duration of each measurement, as well as the maximum storage time and capacity needed.
Standard Data Storage Density
Historical data for heart rate, blood oxygen, body temperature, breathing, and blood pressure are stored with the density of 4 data points per hour (one every 15 minutes) over 7 days. Historical step count data is stored at a density of 1 data point per hour over 7 days. Historical sleep data includes data from the previous day and is stored with the same density as heart rate.
Custom Data Storage Requirements
Customization is at the heart of our SDK’s data management capabilities. Developers can adjust the collection intervals for both processed and pass-through data, controlling how much information is stored and how often it’s updated. This enables the creation of solutions that can range from high-density storage for detailed health records to streamlined datasets for long-term trend analysis.
If you want to customize the data storage method, you need to specify:
- What data to store (e.g., heart rate, steps, temperature).
- Data combination (e.g., heart rate + accelerometer + gyroscope output together is called a data combination).
- Interval for measurements (how often to collect data).
- Duration of each measurement (e.g., PPG data could be 10 seconds per dataset, or 30/60 seconds per dataset).
- Maximum number of measurement packages (total quantity per day, and overall maximum quantity).
- Maximum measurement time requirement (based on the above, e.g., at least 2 days of data volume, including the number of max packages x max capacity per package).
Example for Custom Data Storage
Suppose you request that each PPG measurement is 60 seconds long, and you allow 100 tests per day. This equates to 100 packages of data per day. If you want the battery and storage to last for up to 3 days, that would mean you need capacity for 300 packages. If each second of data is 1KB, you would need storage for 300 packages * 60 seconds/package * 1KB/second = 18MB of data.
Guide
Smart Device Data Management Customization Guide
Data Dimensions: Grasping the full scope of data dimensions is pivotal. Consider heart rate monitoring—it’s not just about capturing the rate, but understanding it in a temporal context: “7 days * 24 hours * 4 readings per hour.” It’s about seeing the full picture.
Acquisition Methods: Acquisition is multifaceted. Some data is best monitored in real-time, offering immediate insights, while other metrics may be collected on demand or at regular intervals, allowing for a broader perspective on health trends.
Storage Density: The essence of storage density lies in its impact on both user experience and device performance. It defines not just the quantity of data stored but also the temporal resolution of that data. For instance, storing heart rate four times an hour offers a balance between detail and efficiency.
It’s essential to engage in a dialogue with our clients to fine-tune our device to their specific data needs. We consider their desired data dimensions, storage density, and how long the data should be kept. Our goal is to tailor the device functionality to provide a personalized user experience.
Through a real-life scenario, we demonstrate how a client maximized six-axis data storage, leveraging a continuous 50Hz sampling rate for detailed motion tracking. The storage duration and capacity were scaled to match the client’s usage patterns—showcasing our ability to offer flexible, client-centric solutions.
We delve into the intricacies of device constraints, such as battery life and power consumption, and how they govern the maximum storage time. Our approach educates clients on how to maximize their device’s storage within these constraints, ensuring a harmonious balance between functionality and practicality.
Acknowledging the limitations imposed by battery life, power consumption, and storage capacity is critical. We present holistic strategies that address these challenges, ensuring that our clients’ needs for data diversity are met without overstepping the device’s operational boundaries.
In summary, this guide underscores the necessity of a nuanced understanding of both device capabilities and client requirements. Our commitment to providing adaptive solutions is unwavering, as we strive to align our technological advancements with the practical demands of health monitoring.
We invite our clients to apply these insights to their unique scenarios and reach out for further discussion. Our team is ready to assist in exploring personalized data management solutions that bring their health-monitoring ambitions to fruition.
FAQ
Historical data for metrics such as heart rate, blood oxygen, body temperature, and steps can be accessed using the Self_Write() function. This data is typically stored at specific intervals (e.g., every 15 minutes) and can be retrieved for up to 7 days.
Real-time data refers to the most current data available from the device. It does not necessarily mean the device is measuring continuously without any gaps. It means the device updates the data periodically and presents the most recent readings upon request.
Custom measurement cycles can be set for sensors like the PPG, but for ECG and other vital signs, the cycles are pre-determined by the hardware and firmware capabilities and are typically hardcoded by the supplier.
If more storage is needed, we can consider adding a storage chip to the device or selecting a model with higher memory capabilities, such as the X5 or X6. Additionally, we’ll need to know the specific requirements for data storage density and duration to ensure the device meets your needs.
Yes, the device can be set up to store measurement data when it’s not connected to the app and then send the stored data upon reconnection. This ensures no data loss even when the device is out of range or not actively connected to the app.
To collect data, you can use the transparentData(int type) function provided in the SDK. For PPG and ECG, the device requires an active command from the user to begin data collection. For accelerometer and gyroscope data, you can start collection through an app command with customizable sampling rates.
Yes, the collection intervals for PPG data can be customized to be automatic at certain times. However, for ECG data, due to the need for user interaction with the device, it cannot be set to collect automatically. Accelerometer and gyroscope data collection can be initiated via the app.
The default sampling rate for the accelerometer is 25Hz, which can be customized to 50Hz, 100Hz, or 200Hz. For the gyroscope, you can set the sampling rate to 50Hz, 100Hz, or 200Hz using the appropriate hardware, such as the X6.
For certain metrics like acceleration and gyroscopic movement, real-time raw data can be transmitted to the app at intervals as low as 100ms. This requires the device to be in raw data mode and may depend on the hardware model and firmware capabilities.
The measurement interval for ACC and Gyro raw data can be set to 100 milliseconds (ms), 500 ms, or 1 second. This corresponds to a data delivery rate to the app at those same intervals.
The data from the accelerometer and gyroscope are calculated based on the sampling frequency. The device can support various sampling rates such as 25Hz, 50Hz, 100Hz, and 200Hz.
Certainly. The sampling rate, measured in Hertz (Hz), is the frequency at which the sensor takes measurements. A 100ms measurement interval is the same as saying the data is sampled at 10Hz, which means the sensor takes 10 measurements every second. The measurement interval is the time between individual sensor readings. So, if a client requests data to be delivered every 100ms, they are essentially requesting a sampling rate of 10Hz. We focus on sampling rates for ACC and Gyro because they are a key factor in determining the device’s ability to capture and deliver data at the intervals requested by the client.
Accelerometer and Gyroscope sensors typically operate with a continuous data stream that requires a defined sampling rate, as they are used to track motion which can change rapidly and frequently. The sampling rate for these sensors is critical because it determines the resolution and accuracy of movement detection.
PPG Raw Data, on the other hand, while it also has a sampling rate, may not always be discussed in the same way for a few reasons:
- Use Case: PPG data is often used to calculate heart rate and blood oxygen levels, which do not change as rapidly as the parameters measured by accelerometers and gyroscopes. Therefore, a high sampling rate may not be necessary to discuss in the context of storage because you typically store the processed results (heart rate or SpO2 measurements) rather than the raw high-frequency data.
- Processing On-Device: Raw PPG data is usually processed directly on the device to extract the heart rate and SpO2 information. This processed information is what is typically stored and used, rather than the raw high-frequency PPG data.
However, if the use case requires storing raw PPG data for detailed analysis or for developing algorithms, then the sampling rate becomes a significant concern, similar to accelerometer and gyroscope data. The decision to discuss or not discuss sampling rates is tied to the specific application and requirements for the data. If precise timing and frequency of physiological events are needed in the analysis, the sampling rate of PPG data would indeed be a crucial point to discuss.
Contact us
Interested in our smartwatches? Excited about tailor-made solutions for your needs? Reach out to us now!
Let’s collaborate to revolutionize healthcare, creating solutions that truly make a difference. We’re eager to hear from you and kickstart a fruitful partnership.